Quick Study: Unassisted Long 2s
Exploring metrics underlying star upside

Disclaimer: I’m on barttorvik so much that I’ve decided to just publish my favorite queries/insights. These statistics should not be taken at complete face value. There are other sources of numbers (notably, Synergy), and all numbers need to be contextualized with film study. I do indeed watch the tape, but find this sort of exercise pretty fun in trying to understand the driving factors of development.
Here’s my goal with this: I will present a pair of 2 players with very similar Barttorvik profiles, but not-so-similar NBA outcomes. My assumption is that the similarity of the two profiles will serve as a sort of “control”; thus, by pinpointing metrics where the more successful NBA player dominated, we can theoretically begin to gain some knowledge regarding the underpinning of NBA success. Basically, if two players have nearly identical statlines but the good player is far better at one particular metric than the other, it is more likely that metric is congruous with the impetus for their NBA success.
Donovan Mitchell and KCP
Donovan Mitchell and Kentavious Caldwell Pope have such similar profiles.

KCP is taller and generally better impact metrics. Higher usage, more efficient, better rebounder. Very similar assist, turnover, and stocks. KCP much better free throw rate.
Verdict: Similar distribution of stats, with KCP having higher impact metrics and better efficiency on higher usage- though its probably somewhat caused by FTR differential. KCP seems better, especially considering accounting for size.

Dunks: KCP better by far
Close 2: KCP better efficiency, Mitchell better voume
Far 2: similar volume and effiency
FT: KCP more volume, similar efficiency
2P: KCP better efficiency, similar volume
3P: same volume, KCP slightly better efficiency
Basic Stats: KCP far better PPG/RPG, but Mitchell averages nearly an assist more per game. This is odd, since Mitchell has a comparable assist% and minutes% to KCP. “Assist%” is not doing Mitchell justice here- we’ll talk about this later.
Well, based solely on the stats, KCP seems like the significantly better player. He’s bigger and more efficient on all parts of the floor, while maintaining the same or better levels of goodness in nearly every stat.
But why is Mitchell a multi-time All Star and KCP isn’t? Again, this is such a good comparison because KCP is equal or better at most stats (thus acting as a control group), so theoretically the metrics in which he performs worse are more likely to be significant for gauging star upside. So where exactly does KCP perform worse than Mitchell?
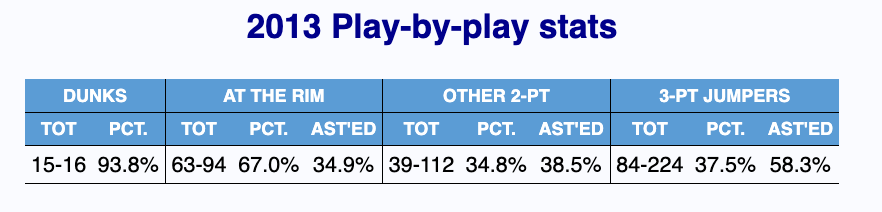
Let’s start with the shooting splits, focusing on the “AST’D” values:
KCP:
MITCHELL:
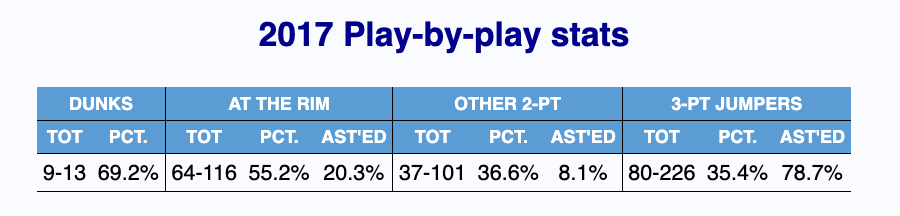
38.5% assisted for KCP vs 8.1% assisted for Mitchell: the inside-the-arc self creation rate difference is really night and day. Self creation on long 2s has something to do with handle and creation burden in the NBA. I’ve had this theory for a while now, but this example really highlights the importance of self created long 2s. Even the rim creation differential is pretty significant. KCP had 94-16 = 78 non dunk rim attempts on a much higher assisted diet than Mitchell. To be fair, 35% assisted atr is still low, so I’m not sure this holds as much projection utility. The real point of contention here is that long 2 assisted difference.
Anecdotally, I’ve found that <25% assisted on long 2s is a rudimentary mark of “eliteness” but that number is obviously more impressive for wings than guards. Based on what we have seen here, I would go as far to posit that long 2 self creation rate is the best indicator of NBA creation upside.
There is one other massive difference in Mitchell’s favor: passing.

While the assist and turnover rates are comparable, Mitchell had double KCP’s assist to turnover rate (A/TO). This hits at my integrated theory of Assist% + A/TO (basically, i believe they far hold more value in tandem than separately), but it also supports what we found before- that assist% understated Mitchell’s assist totals. This leads us to our next micro-conclusion: it’s important to evaluate usage in assist rate. This seems intuitive but ignoring this principle can cause you to overlook the veracity of these assist numbers. KCP looks like the marginally better passer by pure assist rate, but considering usage (and using A/TO as a sort of “check” on unfettered assist rate), its clear that Mitchell was seemingly the better decisionmaker.
So here’s my conclusion: passing goodness and self creation rate (particularly of the long 2 variety) are important distinguishers of ball handling/scoring upside.
This is a decent insight, but let’s try to improve the sample size on this.
Jordan Clarkson and Nick Johnson
I was recently trying to query for Jordan Clarkson and could not manage to get Nick Johnson out of the results. He basically had the same, if not better, stats as Clarkson across the board.

Johnson seems like the far better player. Far better impact metrics (over 2.5x Clarkson’s BPM, better OBPM and DBPM), and very similar efficiency. Johnson seems like the better athlete (= steal and oreb, but way better block and dreb).

Dunks: Johnson clears
Close 2: Clarkson has better volume, similar efficiency
Far 2: Very similar volume and efficiency
FT: Similar volume, Clarkson better FT% by a decent bit
2P: Clarkson better efficiency and slightly better volume
3P: Johnson wayyy better volume and efficiency
Basic: Johnson slightly better rebounder, Clarkson better scorer and passer. Clarkson does play a bit more minutes, but not enough to ignore the stat difference.
Based solely on these stats, I would probably take Nick Johnson over Jordan Clarkson. Better athlete, similar efficiency, and better impact metrics- Johnson seems like a very safe prospect. So let’s ask the same question: based on these relatively similar profiles, what exactly was Clarkson better than Johnson at? How did Clarkson end up sticking in the league but Johnson didn’t?
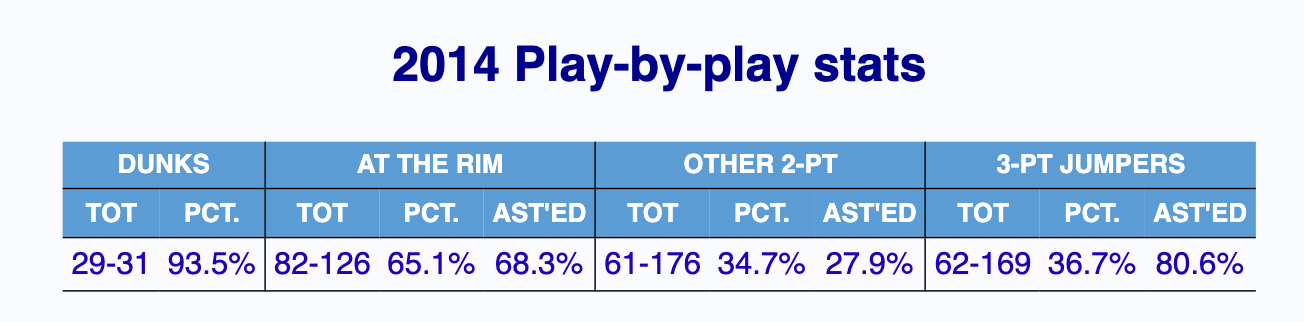
Let’s dive into the assisted rates:
NICK JOHNSON:
JORDAN CLARKSON:
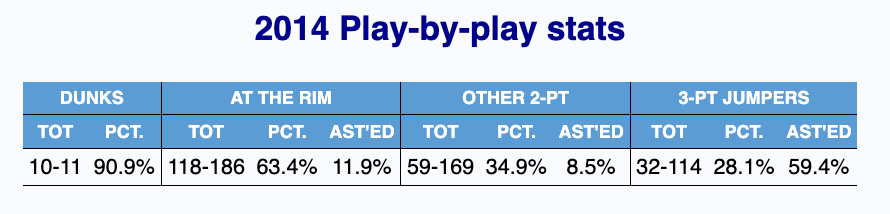
The difference in assisted rates is even more stark. Clarkson was light years better as a self creator than Johnson. As with last time, the long 2 assisted rate is significantly disparate. But what makes Clarkson even more distinct is just how good of a self creator at the rim he was. 12% assisted on 186 attempys and 63% efficiency at the rim is INSANE. The combination of creation, volume, and efficiency has got to be historic. Meanwhile, more than 2/3 of Nick Johnson’s rim attempts were assisted. Even the 3P assisted difference is huge. While Clarkson had a far worse shooting% from 3 than Johnson, he was self creating 20% more of his 3P attempts. Since assisted shots ~ easier shots generally, Johnson’s shot efficiency was almost certainly buoyed by his diet. And it makes sense why Clarkson’s still one of the best bucket getters in the league 10 years later.
The only other point of difference between Nick Johnson and Jordan Clarkson was… you guessed it, the passing.

Yes, Nick did have a better A:TO. But the difference in passing productivity is notable. In retrospect, I think 1.3 ATO is fine, and anything > 1.2 ATO is pretty good. There’s a pretty big difference between 18% assist and 23% assist, as seen by the differential green color indicating relative percentile. Clarkson was not the more efficient passer, but he was almost certainly the better passer. This is why A:TO and assist% need to be used in tandem- I will usually prefer assist% over ATO, especially when the difference in assist% is this large, but of course its important to ensure the ATO isn’t worryingly low.
A/TO, assist rate, and 2P assisted rates seem relatively significant in gauging self creation upside. It’s not that simple though.

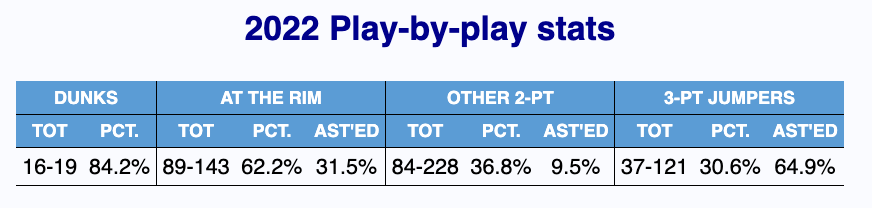
Let’s put one of the biggest busts of the 2020s, relative to college production, to the test. Johnny’s self creation rate was superb. At all three levels, he was scoring at high volume and at a high self creation rate. However, he only passes half of our test: his passing stats are pretty bad. Here’s my two cents:
Proxies are not precise. Johnny had great FT% and clearly his long 2 unassisted rate was awesome. But while these are all proxies for shooting development, they are not perfect: Johnny simply didn’t develop the 3P shot. He also had proportionally low volume from 3, indicating a lack of comfort relative to 2Ps, although this is more nitpicking. According to Synergy, Johnny’s 0-17 ft jumpers were graded as poor at Wisconsin, and he’s anecdotally struggled on such baskets in Summer League/his brief NBA playing time.
Poor decision-making. < 15% assist and 0.9 A/TO are pretty awful numbers for a lead guard, especially at that type of usage (30%). The high usage, low A/TO types of players have a more difficult time acclimating to the league (ie Bouknight), although this doesn’t directly address Johnny’s struggles. A lack of feel may be tangential to his overall issues, but it’s certainly something to note.
My thoughts:
A/TO, assist rate, and 2P assisted rates seem relatively significant in gauging self creation upside. The takeaway regarding assisted% may seem relatively obvious, but if you self create more in college, you are more likely to self create in the league. Moreover, it is easier to scale down than it is to scale up or even laterally. Players with high self creation burdens are more likely to effectively scale down, and in the case of Mitchell/Clarkson, their savant offensive creation continued in the NBA. Not completely sure why long 2 self creation specifically is so predictive of creation upside (as we demonstrated, Mitchell/Clarkson had way higher unassisted %s on long 2 relative to peers without drop in efficiency), but perhaps it’s because barttorvik classifies literally any non-rim 2 as a long 2. So its much more correlated to 2P creation than if u bifurcated nonrim 2P into midrange and runners, for instance.
As for ball handling/passing, the same scalability principle applies. If you are high usage and high assist, you can scale down easier. If you are lower usage but a cerebral decisionmaker, then you can also scale down (or slightly up/laterally for Mitchell). Since passing and handle can both be understood as a proxy for processing ability (need many more words to describe my handle/processing theory), perhaps mistake free/high productivity passers who can also hunt their spot on long 2s are thus more likely to undergo outlier development by virtue of their ability to process and undergo skill acquisition faster/more effectively?
This was great